SEAL’s fundamental research motivation is to map and characterize global change, and to understand the consequences of these changes for the Earth system and society. We use massive datasets, image time series, data fusion, and advanced statistic to map, monitor, and understand global change. Anthropogenic changes to vegetation (e.g. cropping systems, deforestation, etc.) are of particular interest. These maps and data products are critical inputs to models (e.g. coupled ecohydrologic models) that enable an understanding of the consequences of these changes for water, carbon, and food. Example research questions include: How has the global intensification of agriculture affected freshwater availability? How can we feed a growing population without running out of water? Have tropical deforestation mitigation policies been effective? How is vegetation phenology changing in response to a changing climate?
Active Research Projects
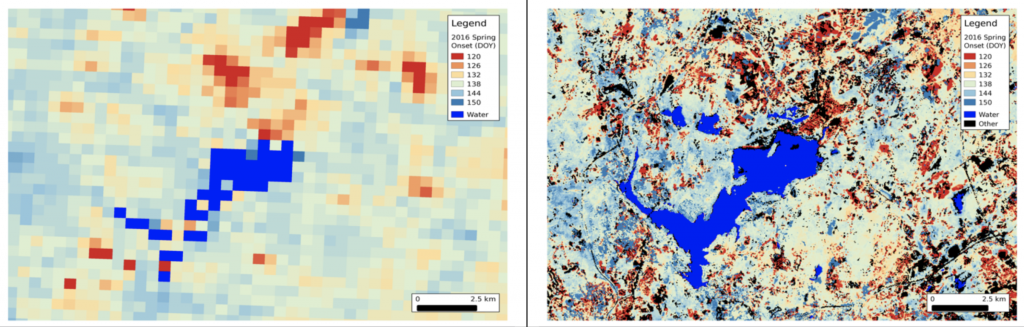
LSP from MODIS (left) and HLS (right). Generated by E. Melaas and M. Friedl
An Operational Multisource Land Surface Phenology Product from Landsat and Sentinel 2 (NASA, Friedl PI, Gray Co-PI): Land surface phenology (LSP) products, which synthesize the timing of phenophase transitions and quantify the nature and magnitude of seasonality in remotely sensed land surface conditions, provide a simple and intuitive way to reduce data volumes and redundancy, while also furnishing rich feature sets that are useful to a wide range of applications including ecosystem and agro- ecosystem modeling, monitoring the response of terrestrial ecosystems to climate variability and extreme events, crop-type discrimination, and land cover, land use, and land cover change mapping. Methods to monitor and map phenology from coarse spatial resolution instruments such as MODIS are mature and operational. However, the spatial resolution of MODIS is inadequate for many applications. The goal of this proposal is to create an operational land surface phenology product based on blended time series of Landsat 8 OLI and Sentinel 2A and 2B MSI data. We propose to generate our product at continental scale for North America at 30-meter spatial resolution using the Harmonized Landsat-Sentinel (HLS) data set that is being generated by NASA, and to distribute our results via the Land Processes DAAC.

Multicropping and its change across Asia (from Gray et al 2014.)
Water, Climate, and Food in the Anthropocene (NASA, Gray PI): The global food production system faces substantial challenges in meeting increasing demand over the coming decades. While production will need to increase 70-100% by 2050, Earth’s most fertile lands have already been cultivated, 70-90% of consumed freshwater is already applied to crops, and climate change will exacerbate production problems in many important food production regions. Satellite remote sensing has an important role to play in meeting these challenges: imagery is invaluable in mapping croplands, monitoring response to weather exposures, and providing critical input to physical models. However, significant challenges have prevented this potential from being fully realized. For instance, while mapping croplands has been a goal of remote sensing science for over four decades, current global maps disagree considerably about the current and historical extent of croplands. Furthermore, mapping change is difficult or impossible with current datasets because they are typically produced for epochs rather than annually. Two outstanding issues have limited progress on these problems: 1) lack of high spatial resolution mapping approaches at the regional- to global-scale, and 2) persistent missing data due to seasonal clouds in some of the world’s most important agricultural regions. This proposal describes research that will address these problems by developing improved analytical methods to combine imagery from multiple data sources in a way that will simultaneously improve the spatial and temporal resolution of regional- to global-scale cropland datasets. Moreover, we will demonstrate the utility of the improved cropland products through modeling experiments which explore the impact of agricultural extensification/intensification and climate change on surface water resources in an important inland basin.

Example LSP-CI data products
A Multi-Scale Satellite-Based Indicator of Climate Change Impacts on Land Surface Phenology (NASA, Gray PI): Our climate indicator will communicate concise, intuitive, and quantitative metrics of climate change impacts on land surface phenology (LSP) at multiple assessment- relevant spatial scales. National-scale maps of LSP normals and interannual anomalies will be produced by applying state-of-the-art algorithms to MODIS and VIIRS image time series. These maps, in combination with statistical summaries of LSP patterns and trends, will provide accessible, intuitive and climate assessment relevant remotely sensed LSP metrics. Further, by developing strategies to seamlessly integrate time series of LSP metrics from MODIS and VIIRS, our e↵ort will lay the foundation for long-term monitoring of LSP in the years to come. To maximize its utility for the National Climate Assessment (NCA), our climate indicator will provide data sets that synthesize LSP results at spatial scales and for geographic units that are of specific rel- evance to NCA Regions and Sectors, and will provide data visualization, exploration, and download tools that link remotely-sensed LSP metrics to ground observations. In doing so, our LSP climate indicator will provide robust metrics of particular signifi- cance to the Sectors, Regions, and Cross-Cutting Topics National Climate Assessment teams. Specifically, we will provide long-term normal and annual anomaly LSP met- rics, and long-term trends in these metrics over time, for the nation, NCA Regions, and individual states. These spatial units are selected to provide LSP metrics in units that are both intuitive and that address National Climate Assessment priorities. A key feature of our proposed climate indicator is that it is designed to be flexible in terms of the geographical units to which is applied, and hence, more focused and specific LSP climate indicators can be produced that are tailored to specific end-user needs. To demonstrate this capability, we will collaborate with scientists at the USGS, the NPN, and the National Park Service to produce LSP climate indicators for National Park lands that will allow park managers to monitor, quantify, and develop strategies in response to climate change impacts on these critical national resources. By working directly with end-users at the NPS and USGS, we will refine the indicators and the way they are delivered to maximize their decision-support value.
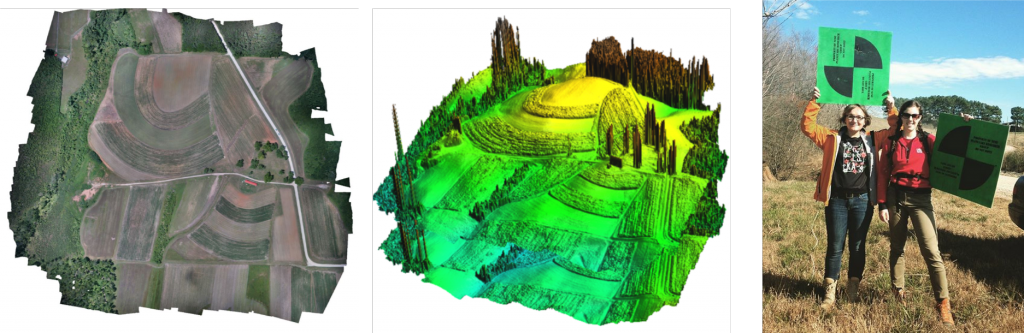
UAS derived orthomosaic and DSM from Lake Wheeler field site
UAS Roadmap (NCDOT, Gray PI): The aim of NCDOT’s Wetland Predictive Modeling (WPM) tool is to help identify the location and extent of jurisdictional wetlands along potential road corridors in order to minimize field campaigns and mitigation efforts. To do so, WPM uses a variety of geospatial data including LiDAR-derived terrain and digital soil maps. These input data can be deficient in a variety of ways that reduce confidence in WPM output. For instance, WPM inputs can be out-of-date, lack the required spatial resolution, or simply be unavailable. Unmanned aerial systems (UAS) are emerging as a potential solution to these problems: they are relatively low-cost, can be operated “on-demand”, and offer a variety of data streams at unprecedented spatial resolutions. It is likely that UAS-based remote sensing can be integrated into WPM workflows in a way that improves model accuracy, thus reducing the cost and improving the outcome of road planning projects. Nevertheless, substantial challenges exist to implementing a UAS remote sensing program for WPM activities. First, there is a large and rapidly growing selection of aircraft, avionics and software packages, and sensors available on the market. Which combinations are most likely to be effective for WPM? Likewise, the science of turning raw sensor feeds from UAS (e.g. LiDAR point clouds or multispectral images) into usable data is emerging and there are no standardized methods. How best to turn UAS observations into WPM-relevant data streams? Finally, the legal/regulatory environment is moving nearly as quickly as the marketplace, and it is challenging to understand how to fly legally and safely. What are safe and effective flight operations for gathering WPM-relevant data? UAS Roadmap is a project designed to answer these questions. The project’s overarching goal is to deliver comprehensive, authoritative guidance and implementation strategies for UAS-based remote sensing that are WPM-specific.

Example of dynamic linear modeling approach to MODIS-Landsat fusion in Borneo
Evaluating Deforestation Mitigation Efforts with Image Fusion and Synthetic Controls (Gray and Sills): Efforts to assess the impact of policies aimed at reducing tropical deforestation and degradation are hampered by a lack of reliable, long-term information on the location, magnitude, and character of forest changes (e.g. forest converted to what?), and difficulty in confidently attributing observed changes in forest extent to a particular policy. For example, the rate of deforestation in an area under a particular policy might go up or down due to exogenous forces such as change in the price of timber. Existing forest change products either do not cover a long enough period of time, have insufficient spatial resolution, and/or do not characterize the antecedent land condition. We are using advanced image fusion techniques to create long time series of high resolution synthetic imagery that can be used to locate, quantify, and characterize forest changes in tropical areas. The use of synthetic control methods allows for the construction of a statistical counterfactual trajectory for areas that received particular policy treatments. This scheme allows us to answer important questions about how innovations in the forest products industry and governance create patterns of deforestation.